
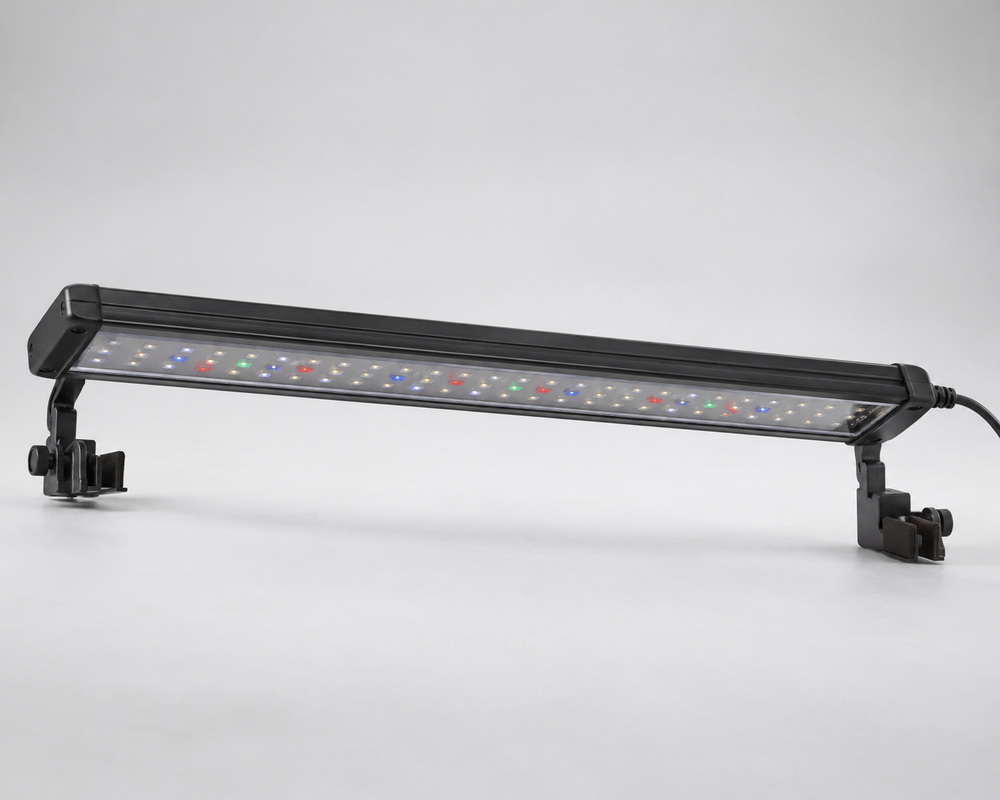
When an aquarium-light report says “140 PAR,” the useful next question is what was measured, where and under which conditions. The number usually describes photosynthetic photon flux density at a location. Its unit, spectral band and position are what let you compare it with another report.
For an aquarium-equipment team, the goal is to understand whether supplied data describes the intended tank and illuminated region. That is a different task from prescribing light levels for a particular plant or coral. The discussion below concerns reading reports for above-water fixture development, not setting up an underwater electrical or measurement experiment.
What PAR means when an aquarium report gives a number
The spectral band and the reported quantity
PAR stands for photosynthetically active radiation. The IES definition identifies the conventional band as 400–700nm. PAR names that spectral region; the reported quantity might be photon flux from a source or photon flux density arriving at a surface.
Aquarium discussions often shorten a PPFD measurement to a “PAR reading.” Understanding that shorthand helps, provided the complete unit and measurement context stay available. Two numbers cannot be compared reliably when one describes a source and the other a position within a tank.
The complete PPFD unit
PPFD is expressed in micromoles of photons per square meter per second: µmol m−2 s−1. The area term matters. A field stated only in µmol/s normally describes photon flux, rather than a surface density.
Write the unit beside the value in the report comparison. This small step keeps a package, fixture and tank-location number from appearing to be interchangeable because each uses the word PAR.
What watts, lumens and visible brightness tell you
Electrical input and human visual response
Watts describe electrical input at a stated operating condition. Lumens describe light using the human visual response. They are useful product fields, but neither provides the PPFD at the substrate or another target location.
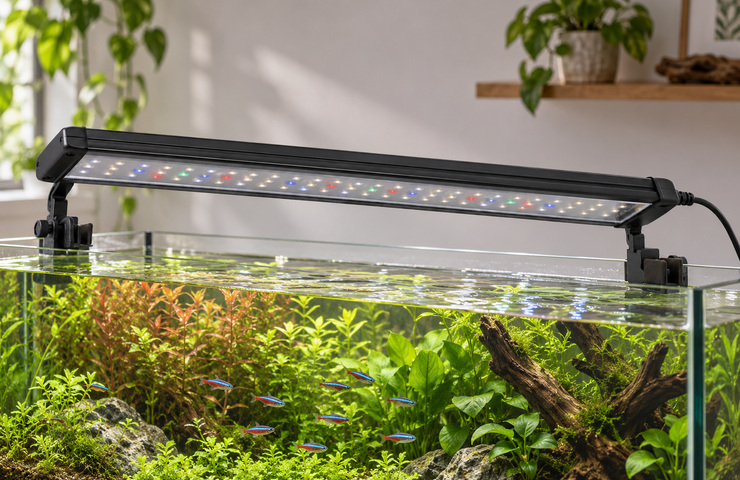
A brightly photographed tank is also an appearance record, not a calibrated photon measurement. Camera exposure, white balance, water clarity and the viewed materials influence the image. Use a photograph to understand source position, mounting and the visible environment; use the relevant report for the numerical comparison.
The field needed for the aquatic light question
For a target at a stated depth, look for a location-specific photon measurement or map. If two lights have different spectral distributions, a fixed conversion from lumens to PPFD is not an adequate substitute. The conversion would need information about the spectrum and the reporting geometry.
The intended task determines which evidence is useful. A display-color choice needs an appearance assessment. A stated photon-delivery requirement needs the corresponding quantity at the target. Neither answer supplies a complete husbandry plan.
Depth and position belong beside the reading
Fixture-to-water and water-depth references
A distance below the fixture is not necessarily the same as a distance below the water surface. A report should identify its reference plane. Moving the fixture, changing the water level or using a different measurement depth changes the geometry being described.
Read the tank dimensions and the fixture’s installed position together. A value taken in air above an empty tank does not describe the same optical situation as a reported underwater value at the substrate. Covers, lids, water and obstructions belong to that comparison where present.
For a dimensional illustration, assume the emitting face is 10cm above the water and the stated target is 30cm below the surface. Their vertical separation is 40cm. A report labeled 30cm from the fixture describes a different position. These are assumed coordinates used to explain the references, not a fixture height recommendation.
Adding those distances identifies the geometry; it does not calculate the PPFD. The source distribution and optical path still determine that quantity. A side view or coordinate definition supplied with the report is therefore useful even when a table already contains many numerical readings.
Center, edge and shadowed positions
A centerline value describes a particular location. An extended planting area also has edges and positions affected by the hardscape or other obstructions. The distribution across that area can matter more to the stated brief than the highest value below the source.
| Report field | What it should identify | Why it changes comparison |
|---|---|---|
| Depth reference | Water surface, fixture or another defined plane | Equal numbers may describe different target locations |
| Fixture position | Height, centering and the supplied mounting arrangement | The light distribution belongs to that geometry |
| Tank condition | Water, cover and relevant obstructions | The optical path can differ from an empty setup |
| Sampling positions | Locations within the stated footprint | A central peak cannot establish all-area coverage |
| Operating setting | The identified source/channel setting | A different setting describes a different output state |
Sensor range and correction status affect comparability
Spectral integration and sensor response
A quantum sensor has a spectral response, rather than an ideal ability to count every wavelength identically. Its response and calibration matter when the light contains a different spectral mixture from the condition for which it was characterized.
Also read the reported integration band. A conventional 400–700nm PPFD field and a wider-band photon field include different wavelengths. A report using an extended range needs to state it clearly; the larger interval should not be silently substituted for a conventional PAR requirement.
A correction already applied versus a raw reading
Immersion treatment depends on the actual sensor and reporting method. Apogee Instruments’ Quantum Sensor FAQs distinguish products with a correction already applied through firmware or software from readings requiring a model-specific treatment. This is a reason to identify the instrument and correction status in the supplied report.
Do not apply a second correction merely because the measurement was underwater. Conversely, a raw value cannot be assumed to have the treatment already included. There is no single multiplier that this article can responsibly assign to every aquarium report.
For a report-reading decision, the necessary information is the instrument identity, applicable calibration and whether the displayed values already include the required treatment. The equipment’s own instructions govern its operation.
A report may also state a spectral-error allowance or a calibration uncertainty. Keep its scope attached: a characterization under one source spectrum is not automatically the same error for another spectrum. Where close numerical differences affect the choice, the relevant uncertainty is part of the comparison rather than a detail to discard after reading the headline value.

Read a map from its peak to its covered area
The assumed equal-area report
Consider this teaching example: nine equally weighted reported positions in equal-area cells on one declared plane, all in µmol m−2 s−1. Assume the project brief requires at least 80 at every reported position. These values and the requirement are hypothetical, not a VST test or a biological threshold.
| Reported row | Left | Center | Right |
|---|---|---|---|
| Back | 80 | 100 | 80 |
| Middle | 100 | 140 | 100 |
| Front | 70 | 90 | 70 |
Calculate the mean and inspect the lowest cells
The sum is 830. Dividing by nine gives a sampled mean of approximately 92.2. The peak is 140 and the sampled minimum is 70. Although the mean exceeds 80, the two front corner values are below the assumed requirement.
The arithmetic mean describes these reported samples. It does not prove a continuous-area average or reveal what happens between the locations. Unequal sampling weights or a different footprint would require a different interpretation.
For an actual submission, read any rounding and uncertainty information beside a value close to the requirement. In this teaching table, the values are treated as exact stated inputs so the arithmetic is transparent. A rounded real reading of 80 is not, by itself, an acceptance margin; the project’s agreed evaluation method must explain how such a boundary is handled.
Decide whether the stated requirement is met
This report does not meet the specified requirement at every reported position. Selecting it solely because of the 140 peak would miss the failed cells. A useful next design comparison would address coverage in those regions at the intended plane.
That outcome is already a decision: the supplied map cannot support the stated coverage claim. It is more informative than requesting a generally “brighter” light, which leaves the distribution problem unresolved.
Compare reports for the same intended tank position
Operating settings and tank geometry
Compare the setting and geometry you intend to use. A higher mounting position, changed optical cover or different channel mix can alter the reported result. Keep the actual tank opening and service arrangement in view too: an optically promising fixture still needs a workable above-water mounting route.
A controller percentage is an operating label, not a universal photon conversion. Two products at the same displayed percentage can have different outputs and channel mixtures. Likewise, dividing a full-output map by two does not establish the actual map at a 50% control setting unless the supported behavior justifies that relationship.
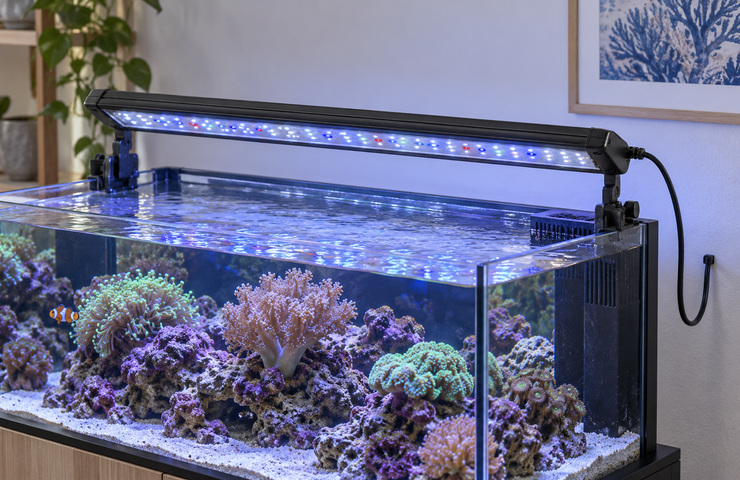
A rim-mounted assembly occupies the tank edge. A suspended assembly relies on a separate support and access space. Those choices affect lid movement, cleaning access and where the light can sit. They are useful product-development inputs, not evidence that either construction is suitable for every aquarium.
Coverage versus a single central value
Where the brief concerns an extended region, favor data that describes that region. If one report supplies a map and another only a center value, the difference is in evidence coverage as well as output. You cannot rank their edge delivery from the available central numbers.
The general PPF/PPFD explanation provides the quantity foundation. The aquarium-specific addition is to retain the water, position, depth and instrument context when using that foundation.
Turn the data into a bounded lighting choice
Use the report to answer the question it actually describes. A comparable map can help select an optical arrangement for a stated target plane. It cannot, by itself, establish a universal plant or coral light prescription.

| Available information | Decision supported | Remaining limit |
|---|---|---|
| Comparable map at the intended plane | Evaluate the stated sampled coverage requirement | Unreported positions and other operating states remain unknown |
| Only a central reading | Describe that location at the stated condition | Edge and shadowed-area coverage is not established |
| Source output without a tank map | Compare source-level quantity on an equivalent basis | Tank delivery still needs applicable spatial evidence |
VST’s custom aquarium-light development page describes above-water mounting and integration choices. A defined target region and a correctly interpreted report give that development discussion a useful starting point.

